Valid for Sitecore
5.3
The Debugger Menu
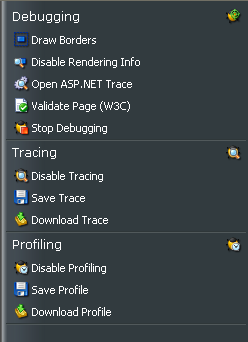
A fly-out menu is available by moving the mouse pointer to the right edge of the page. The menu contains the commands which control the debugging process.

This panel contains the basic debugging controls. The captions of the links in the Portal panel indicate their current setting. When, for example, the Trace setting is disabled, the appropriate link displays the caption “Enable trace”; otherwise, the caption is set to “Disable Tracing”.
Note: In Debug mode by default Caching is not used. In order to enable caching renderings in Debug mode you should “Disable Rendering Info”.
1. The Debugging Section
-
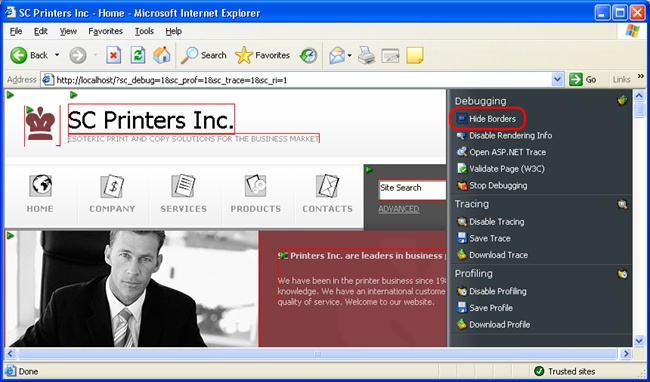
Draw / Hide Borders
Draws a red border around each component on a page.
-
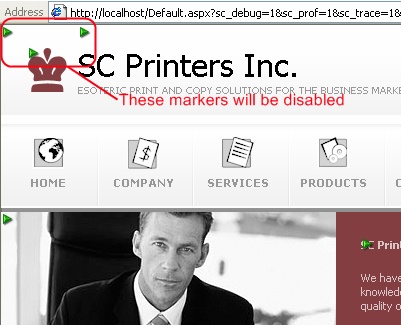
Enable / Disable Rendering Info
Shows Info Markers near each rendering. Info Markers are used to display the Rendering Info Windows.
-
Open ASP.NET Trace
When this button is selected, ASP.NET Application Trace will open in a new window. Read more about Microsoft ASP.NET trace. -
Validate Page (W3C)
Click to validate the rendered page using the W3C Markup Validator. Read more about W3C Markup Validation Services. -
Stop Debugging
Click to stop the debugging process. The page will be rendered without the debugging features.
2. The Tracing Section

-
Enable / Disable Tracing
Show or hide tracing information. -
Save Trace
Click to save the current trace results. A prompt window where you can specify the resulting file name will open. Resulting file has XML format. -
Download Trace
Click to download the trace results.
3. The Profiling Section

-
Enable / Disable Profiling
Show or hide the profile section.
-
Save Profile
Click to save the current profile. A prompt window where you can specify the resulting file name will open. Resulting file has XML format.
-
Download Profile
Click to download the profile.